
The average Harlow home was worth £317,113 in September, up 3.9% in a year and second only to Maldon in Essex. Prices have barely moved since July.
The average Harlow home was worth £317,113 in September 2026. That is £11,949 more than a year earlier, a rise of 3.9%.
Only Maldon rose faster among the fourteen local authority areas in Essex. Essex as a whole rose 0.5%, the East of England 0.7% and England 0.8%.
The figures come from HM Land Registry’s UK House Price Index for Harlow, published on 18 November.
The climb has stalled since July
The annual figure flatters the last three months. Month by month, Harlow has hardly moved since the summer:
- July: £317,788
- August: £317,059, down 0.2%
- September: £317,113, up £54 and 0.0% on the month
Most of the year’s rise came earlier. In September 2025 the Harlow average was £305,164, and it was falling: down 3.4% on the year before. So part of this year’s gain is the town making back what it lost in 2025.
It has still not made it all back. The Harlow average peaked at £326,914 in January 2023. September 2026 is £9,801 below that peak. The index reads 97.0, where January 2023 is set at 100.
Where Harlow sits in Essex
Harlow remains one of the cheapest places in the county to buy, even after a strong year. Only Tendring, at £258,932, and Colchester, at £297,638, are cheaper.
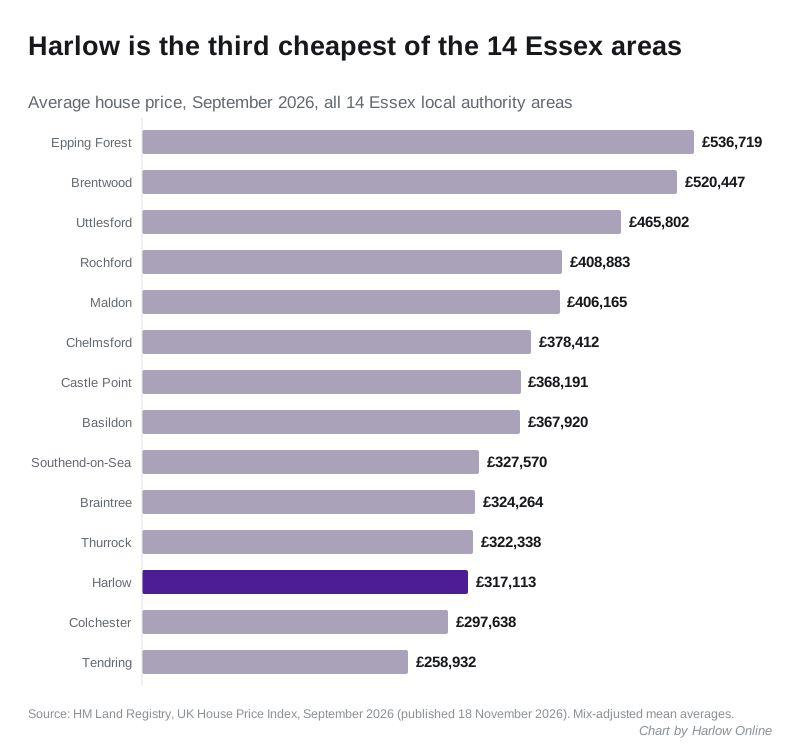
Epping Forest, which wraps around Harlow to the south, west and east, averages £536,719. That is £219,606 more than Harlow. Across the border, East Hertfordshire averages £455,649.
The annual change across the county, from the same release:
| Area | Average price | Change over 12 months |
|---|---|---|
| Maldon | £406,165 | +5.0% |
| Harlow | £317,113 | +3.9% |
| Epping Forest | £536,719 | +2.1% |
| Southend-on-Sea | £327,570 | +1.8% |
| Rochford | £408,883 | +1.3% |
| Colchester | £297,638 | +0.9% |
| Basildon | £367,920 | +0.8% |
| Braintree | £324,264 | +0.5% |
| Brentwood | £520,447 | +0.2% |
| Uttlesford | £465,802 | −0.5% |
| Thurrock | £322,338 | −0.7% |
| Castle Point | £368,191 | −0.7% |
| Chelmsford | £378,412 | −0.8% |
| Tendring | £258,932 | −2.2% |
Five of the fourteen areas lost value over the year. Tendring fell furthest.
Houses rose, flats barely moved
| Type | Average price | Change over 12 months |
|---|---|---|
| Detached | £625,974 | +4.0% |
| Semi-detached | £434,227 | +5.0% |
| Terraced | £319,035 | +4.7% |
| Flat or maisonette | £181,964 | +1.6% |
Semi-detached and terraced houses did best, at 5.0% and 4.7%. Those are the homes most of Harlow lives in, so the headline is not being carried by a few large houses.
Flats rose only 1.6%. A Harlow flat now costs £137,071 less than a terraced house in the same town.
What it means for you
If you are buying your first home. The index puts the average first-time buyer purchase in Harlow at £286,294 in September, up 3.9% on the year. A home mover paid £377,875 on average, so the step up from a first home to the next one is about £91,600.
If you are selling. This is a district-wide average, not a valuation. It is a mix-adjusted mean, built from completed Land Registry sales, so a few dear or cheap sales in a small district can move it. The median sold price in each ward is on our Harlow house prices page.
If you are watching the market. Sales counts lag because recent sales are still being registered. The index recorded 69 Harlow sales in July, the latest month with a count, after 60 in June and 75 in May.
Correction to our July figures
When we reported the July 2026 figures on 19 September, we gave the Harlow average as £319,860, up 4.4%. Land Registry has since restated July as £317,788, up 3.7%. That is £2,072 lower than we published. Harlow was still the biggest riser in Essex in July on the revised figures.
Revisions are normal. Each monthly release restates earlier months as late sales are registered, and the September figure will be revised in the same way.
Sources
- UK House Price Index, Harlow, September 2026, HM Land Registry
- UK House Price Index, Harlow, January 2023, HM Land Registry
- UK House Price Index, Harlow, September 2025, HM Land Registry
- UK House Price Index, Essex, September 2026, HM Land Registry
- UK House Price Index, England, September 2026, HM Land Registry
- UK House Price Index, Epping Forest, September 2026, HM Land Registry
Have your say