
82.9% of Harlow's 16 to 64 year olds were in work in the year to June 2026, up from 67.9% two years earlier. Only three of 348 council areas rose further.
An estimated 82.9% of Harlow residents aged 16 to 64 were in work in the year to June 2026. Two years earlier the figure was 67.9%.
The figures come from the ONS Annual Population Survey, published on Nomis.
Overview
- Employment rate: 82.9% of 16 to 64 year olds, July 2025 to June 2026
- Two years earlier: 67.9%, July 2023 to June 2024
- People in work: about 43,700, up from about 37,500
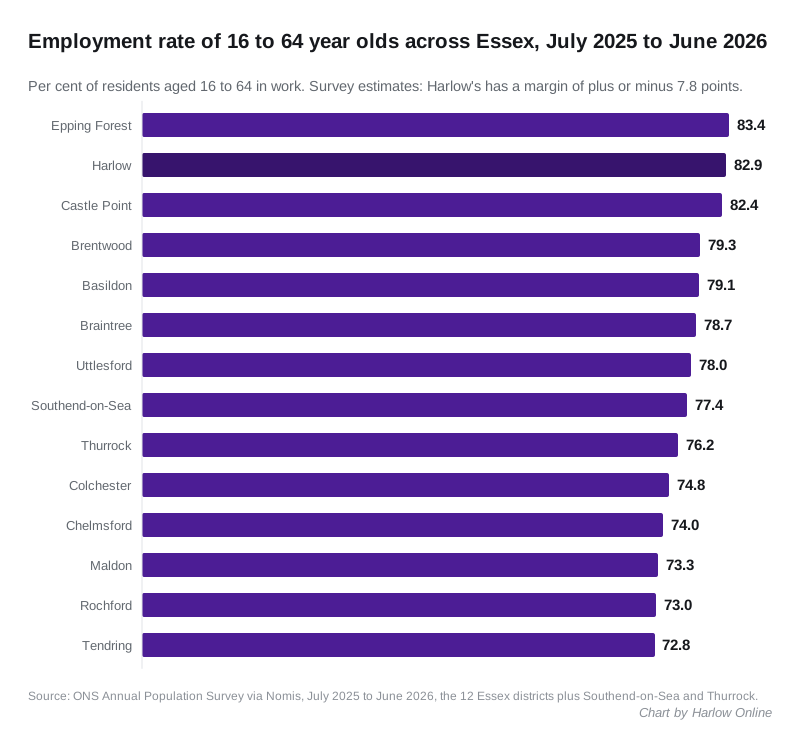
- In Essex: second highest of 14 areas, just behind Epping Forest on 83.4%
- Nationally: above England’s 75.8% and the East of England’s 78.0%
One of the biggest rises in Britain
We compared the same two periods for every council area with figures for both. Harlow’s rise of 15.0 percentage points was the fourth biggest of 348 areas. Only Pendle, Ribble Valley and East Suffolk rose further.
On the level itself, Harlow ranked 31st of the 348.
The climb has been steady over the last two survey years:
| Year (July to June) | Harlow employment rate | People in work (estimate) |
|---|---|---|
| 2021 to 2022 | 78.9% | not used |
| 2022 to 2023 | 67.5% | not used |
| 2023 to 2024 | 67.9% | 37,500 |
| 2024 to 2025 | 75.8% | 41,700 |
| 2025 to 2026 | 82.9% | 43,700 |
Part of the two-year jump is a recovery. In 2021 to 2022, before the dip, the rate was 78.9%.
Read the number with care
The Annual Population Survey is a sample survey, and Harlow is a small district. The ONS gives Harlow’s latest figure a margin of error of plus or minus 7.8 percentage points. Two years ago the margin was 12.6 points.
So the true rate could sit anywhere from about 75% to about 91%. A sharp swing in one year can be partly down to who happened to be surveyed.
The survey’s estimate of Harlow’s working-age population also fell, from 55,100 to 52,700. Some of the rise in the rate comes from that smaller base, not only from more people in work.
A different picture for young people
Other figures point the other way. The ONS claimant count, which counts people rather than sampling them, showed 2,895 Harlow residents claiming unemployment-related benefits in October. That was 4.6% of 16 to 64 year olds.
Among 16 to 24 year olds, 585 were claiming in October. As we reported on Tuesday, that is the highest figure for the age group in the five years of data we checked. Harlow’s MP Chris Vince said this week that leaving the situation as it is “would be a moral stain on any MP who allows it to continue”.
What it means for you
- The share of Harlow’s working-age residents in a job is the highest in the five survey years we checked.
- Survey figures for a district this size move a lot from year to year, so treat one year’s jump with caution. The ONS updates them every quarter.
- The rise has not reached everyone: claims from 16 to 24 year olds are at a five-year high.
Source: ONS Annual Population Survey, employment rate aged 16 to 64, via Nomis (dataset NM_17_5), periods July 2021 to June 2026, all council areas; ONS claimant count via Nomis, October 2026.
Have your say