
Harlow had 2,850 people on unemployment-related benefits in June, 4.6% of working-age residents and above every neighbour; Passmores tops the wards at 6.3%.
2,850 people across the Harlow district were claiming unemployment-related benefits in June, according to the Office for National Statistics claimant count: 4.6 per cent of residents aged 16 to 64. That is the highest rate anywhere in the area, well above the 3.3 per cent average for the East of England and the 3.9 per cent figure for Great Britain, and it stands out even more sharply against Harlow’s neighbours: Epping Forest is on 3.1 per cent, while East Hertfordshire and Uttlesford are both on 2.0 per cent. (ONS claimant count, published via Nomis)
The claimant count records people claiming Jobseeker’s Allowance plus those on Universal Credit who are required to look for work. It is not the full unemployment measure, but it is the only jobs figure published every month for small areas, which makes it the best regular signal of how the local labour market is moving. Every figure is rounded to the nearest five. The direction of travel in Harlow is quietly worrying: a year ago the district had 2,720 claimants, a rate of 4.4 per cent, and the count dipped as low as 2,605 in July 2025 before climbing through the spring. It has sat above 2,800 every month since February, and June’s 2,850 is the highest figure in the thirteen months of data. (Nomis, claimant count for Harlow, retrieved 12 August 2026)
Ward by ward: a threefold gap across one small town
The ward figures are what make the June release worth reading locally, and in a district as compact as Harlow the differences are striking.
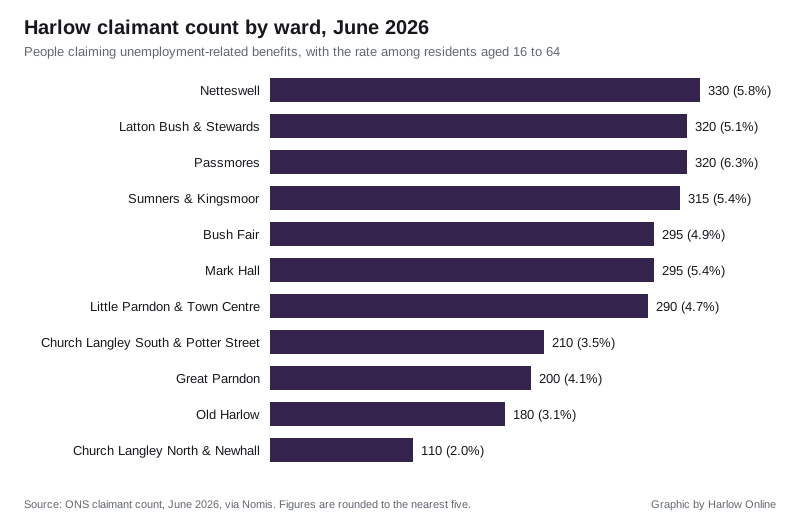
Passmores has the highest rate in the district: its 320 claimants are 6.3 per cent of working-age residents, about one adult in sixteen. Netteswell has the largest count, 330 claimants at 5.8 per cent, and Latton Bush & Stewards matches Passmores’ 320 at a rate of 5.1 per cent. Sumners & Kingsmoor and Mark Hall both run at 5.4 per cent, and Bush Fair and Little Parndon & Town Centre are close behind. At the other end of the scale, Church Langley North & Newhall has 110 claimants at 2.0 per cent, which means the claimant rate in Passmores is more than three times the rate a short drive away across town. Old Harlow sits at 180 claimants, 3.1 per cent, and Great Parndon at 200, 4.1 per cent. (Nomis, claimant count by ward, June 2026)
The rise is concentrated among under-25s
The age breakdown explains most of the year’s increase. Claimants aged 16 to 24 rose from 465 in June 2025 to 555 in June 2026, a jump of 90 that accounts for the bulk of the district’s overall rise of 130. Claimants aged 25 to 49 edged up from 1,595 to 1,645, while the over-50s actually eased slightly, from 660 to 650. Nearly one Harlow claimant in five is now under 25, which matches the national pattern of a labour market that has become hardest to enter at the start of a working life. (Nomis, claimant count by age, retrieved 12 August 2026)
What it means for you
If you are looking for work in Harlow, the numbers say the local market is the tightest in the area, and toughest of all for school and college leavers competing with a growing pool of under-25 claimants. If you have lost work or your hours have been cut, the main route into support is Universal Credit, claimed online, and low-income households can also apply for Council Tax Support through Harlow Council, which cuts the bill rather than paying cash.
A steady jobs market also underpins what homes change hands for; our Harlow house prices page tracks what properties across the district actually sell for. The July claimant figures are due from the ONS later this month; we will report them when they appear on Nomis.
Have your say